We’ve been merging and appending research and customer databases for over 25 years. Why integrate data? Each data type has its strengths and weaknesses and in combination can give additional insight (the new boy on the block is social media):
| Survey | Database | Social media |
| Contexted — rich in contextualising variables | Lacks context —variables captured in isolation (except time, occasion and general socio-demographics) | Ephemeral context, if any. Time stamped. Frequently superficial and reactive. Very biased. |
| Forward-looking —can measure intentions and reactions to new situations | Backward- looking —only captures what has already happened | Real time |
| ‘Soft’ —subject to psychological biases such as forgetting | ‘Hard’ — not affected by psychological response biases | ‘Soft’ —subject to and driven by psychological biases such as influencing |
| Diagnostic —enables inference about causes and motivations | Largely descriptive/ correlative | Random |
| Highly structured | Semi-structured | Unstructured |
| Amenable to most statistical techniques | Suitable for machine learning and predictive analytics | Amenable to text analytics and translated into ‘sentiment’; waiting for AI! |
The types of merging/analysis fall broadly into three types and require structured data:
Appending fields/variables: If you have a common key then you can simply append the data. Depending on objectives the unmatched records are either retained or discarded. Sometimes a common key can be created by merging several fields in both data sets (e.g. postcode and house number).

There are various database terms to describe joining types (inner, left, right and full). The one above is an ‘inner join’ which returns only those records which match the key in both tables. The other types describe formal ways of handling missing data.
Data fusion: If there isn’t a common key then some form of data fusion is necessary. This doesn’t match at an individual case level but uses either a grouping variable (such as segment) or several variables common to both data sets. For example, if data set A contains cases with gender and country, and data set B country and preference, then via country we can infer the relationship between gender and preference. As this is inferred via country any relationship will be weaker than measuring directly but it may suggest opportunities worth exploring further. One thing to avoid with this is biasing a relationship, for example, using segment as a matching variable when segments are partly defined by preference and/or gender. Data fusion is algorithmic an depending on the algorithm and matching variables used will produce slightly different results.
Data fusion is analogous to synthesis in a qualitative context as broad conclusions are drawn from multiple sources where the supporting evidence all points in the same direction.
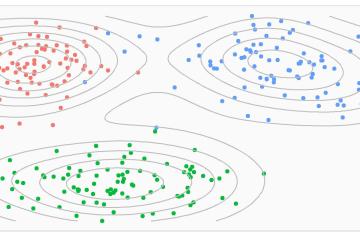
Appending classifications: The third form is appending a behavioural segment or other derived factor onto a customer database. Segments may be derived using a clustering algorithm based on behavioural data and should give insight into opportunities. Transactional data is appended to the research data and then used to derive a classification algorithm that can use the transactional data to classify cases into segments with a reasonable level of accuracy. This algorithm is then supplied to the client for implementation. Care must be taken with this approach though as with too many transaction types it is easy to overfit; what this means is that you must have a training and a test data set, to check the algorithm.
For the last decade there has been much excitement over ‘big data’, even though the definition remains elusive. Big data can be broadly divided into transactional customer data, which we’ve been dealing with for some time and unstructured social media data. The challenge with social media data is finding a way to structure it that gives something other than superficial, immediate event, often context free, biased, insight. Its value for entertainment and influence are proven. Its value for meaningful strategic insight remains elusive.
Transactional data comes from customers who choose to transact with you. Although this is often ‘big’ its nature is confined to a single context; it captures limited information (if any) about those who didn’t transact. Few databases are set up with aggregate analysis in mind, the route by which data gets into the database may be unclear and practices change over time. The first step in dealing with this is an audit with the ‘owner’; this itself can provide clients with unexpected insight and will result in a go/no go decision about what data can be used.
However, there is value and insight to be gained from combining data from different sources, even if this only points the way to where more investigation is required.


0 Comments