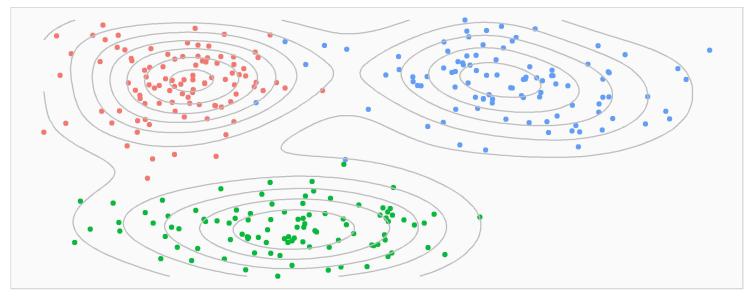
Segmentation is equal parts process, art and science. Process because there are distinct steps, art because solutions are crafted to meet specific objectives, science because the tools used attempt to apply objective criteria. It is also referred to as clustering. Conceptually it is frequently visualised in two dimensions, however, real solutions are multi-dimensional and are frequently challenging to reduce to this format.
What is segmentation?
A segmentations goal is to identify interesting groups of entity (people or businesses), that on certain characteristics resemble each other within their group and differ from entities in other groups. This can then be used to target or develop specific products or services for specific groups. Classification is useful when you encounter or research entities that weren’t involved in the original analysis.
What types or segmentations are there?
Consumer segmentations may be needs and/or behavioural based. B2B segmentations add structural classifications to this.
Why segment customers?
To better target existing products to existing customers, sell existing products to similar or new customers, better develop new products for existing customers, identify new products for new customers.
How do you do it?
The process starts off with understanding the objectives, before gathering the required data, which may involve blending research, internal client data and/or commercial geodemographic databases such as MOSAIC or TGI.
Frequently, ‘flatlining cases’ (cases with very similar responses for all needs questions), are put to one side. These usually consist of two small groups, the indiscriminately enthusiastic and the indiscriminately unenthusiastic. Normalisation, (putting variables onto the same scale) and data transformations can be applied, either formally or automatically by algorithms to improve results and reduce bias introduced by using scales with different ranges.
Initial segments are algorithmically created (this is a very iterative process – the art and the science) and subsequently assessed against theory, robustness, interpretability, actionability and predictability. Candidate solutions are run by the client to agree the best solution. Fuller profiles are then created. Implementation may involve workshops and/or re-organisation. Usually a classification algorithm is supplied to tag future customers.
What techniques and tools are best?
Different techniques produce different solutions on different data sets, so several techniques are usually tried. Data should be normalised (put on the same scale) as all algorithms rely on distance or probability measures, which if not normalised may result in undue influence from large variables with a larger range.
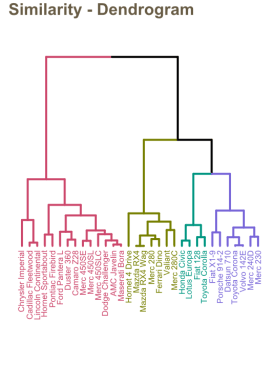
Some techniques are better for certain data types; k-means assumes scalar data, latent class and two-step can handle mixed data, hierarchical clustering, with increased number of variables, quickly becomes computationally intensive (but for small data sets with only a few hundred cases, can look intuitively appealing).
Classification techniques perform with varying levels of success, again experience, trial and error are needed, to find good solutions. Overfitting should be avoided (all models tend to overfit with small samples). Naive Bayes classifiers (straightforward probability based) are flexible and scalable, discriminant analysis is usually a strong contender and may outperform multinomial logistic regression on occasions. Tree based classifiers (historically CHAID) have made many recent computational advances within machine learning. Techniques such as random forests and other ensemble techniques work well on large data sets, however, these may be undesirable from a comprehension and insight perspective as they are ‘black box’; inputs and outputs are observable, but the workings are not transparent. The algorithms are also not easily transportable.
Any other uses for clustering?
Even if it is not a formal objective it is sometimes useful to try clustering to see which characteristics are associated with each other. In some ways clustering can be viewed as a data reduction technique that operates on cases and identifies the key characteristics within the data.


0 Comments